
This post presents electricity data for South Australia, leading up to and including the state-wide blackout on 28th September 2016. The 5-minute data available to the public is insufficient to allow any conclusion to be reached about the cause of the blackout, but it illustrates several important characteristics of the electricity generation within the state, some of which may have had something to do with the blackout.
The AEMO are investigating the blackout, and so far have produced two interim reports, available here:
- http://www.aemo.com.au/Media-Centre/Media-Statement-South-Australia-Interim-Report
- https://www.aemo.com.au/Media-Centre/Update-to-report-into-SA-state-wide-power-outage
The following figure shows the contributions to the electricity supply in South Australia in the days leading up, and the day after, the blackout:
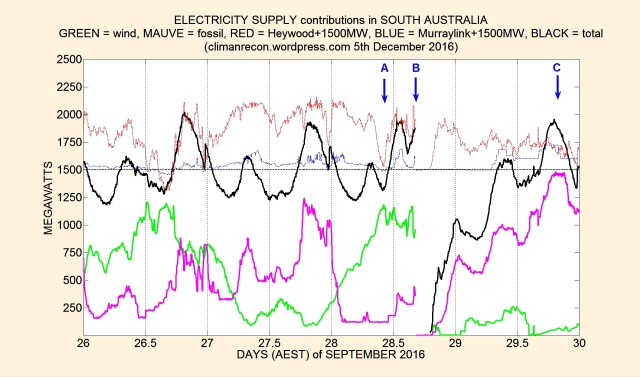
Three events of interest are marked A, B, C on the figure above, and discussed below:
A: The rise in consumption (black curve) at this time is unusual (at least different to that of the 26th and 27th, a Monday and Tuesday), starting before noon. Note also that the consumption fell shortly after noon, then rose again before the blackout at B. One possible explanation is solar PV rising and falling as the storm on that day came and went, if so then solar PV may have played a part in the blackout via a relatively unpredictable modulation of the demand placed on the other sources of supply.
C: After the blackout the system recovered quickly, thanks to the conventional generators (the mauve curve) being able to respond to demand, peaking at nearly 1500 MW.
The following figure shows the outputs of all the wind farms in the state, grouped into 3 regions:
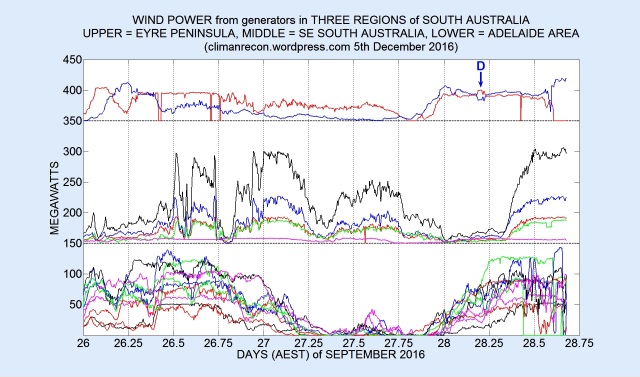
The strong winds on the blackout day of 28th September had most impact on the wind farms in the hills to the North of Adelaide (the lower set of data), with many of their outputs fluctuating wildly in the last few hours, presumably as their over-speed thresholds were exercised. Note also the feature marked D on the figure above, a short period where the outputs of two separate wind farms (Cathedral Rocks and Mount Millar) varied closely in anti-phase.
The following figure shows the hours before the blackout in more detail, showing only the wind farm outputs North of Adelaide (excluding Hornsdale, which earns a gold star for maintaining a relatively stable output during the storm):
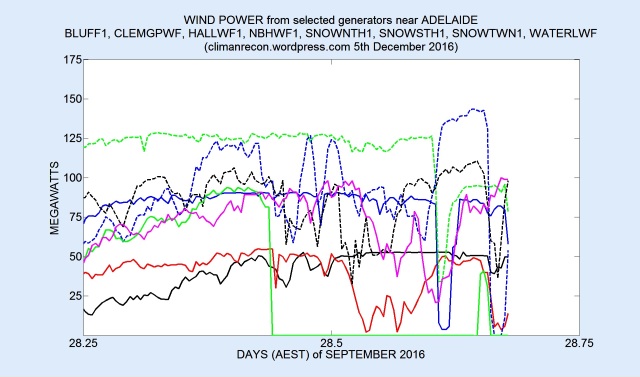
It seems likely that the fluctuations in wind farm output continued during the 5-minute interval containing the blackout, and these fluctuations may have had something to do with it.
CONCLUSIONS
Fluctuations in both solar PV and wind power may have been substantial in the minutes leading up to the state-wide blackout of 28th September 2016, and may have had something to do with the blackout. Only the AEMO, with its data at much finer resolution, can settle the issue, but so far they have made no mention of these fluctuations, concentrating instead on wind farm responses to voltage fluctuations.

Posted earlier on another site, prior to the AEMO preliminary report:
The issue was that there was relatively little thermal generator capacity online at the time so that there was not enough electrical inertia (synchronous inertia is the term that power engineers use) to absorb the shocks. In a stable grid main grid would stay up while the sections where surges and shorts occurred would be isolated and blacked out.
The reason there was so little thermal generator capacity online (only the 4 x 200 MW Torrens B generators were up) is that the relatively high wind farm output meant the pricing was too low for the other baseload generators (Torrens A 4 x 120 MW, Pelican Point CCGT 478 MW) to reach their bid thresholds so without capacity payments, there was no economic incentive for them to be running, even as spinning reserve. Note: all 3 of these power stations are located close to Adelaide. There was also 260 MW of peaking plant online (Ladbrokes and Hallett).
Since almost all of the wind turbines installed in Australia are now doubly fed (Type 3) or full converter (Type 4) and do not have synthetic inertia circuits, the 1580 MW of wind capacity in South Australia provides ZERO synchronous inertia for grid stabilisation.
I am confident that the final analysis will show the pylon collapses in the region northwest of Adelaide created a large short circuit which caused the grid frequency to drop (because the Torrens B generators alone did not provide enough synchronous inertia to maintain the grid frequency in the face of the sudden current surge). This tripped the Heywood interconnector (else the power rating for this would have been exceeded), leaving South Australia as an island grid.At this point the South Australian demand would have greatly exceeded the amount being generated and without much synchronous inertia, there was not enough time to allow for ramping nor demand shedding to take place before the generator units tripped and the grid collapsed.
So the renewables did not cause the blackout directly but their effects on the South Australian grid operations are what led to the conditions where the grid stability was inadequate. In the past, there would have been large blacked out portions of South Australia but the whole grid would not have gone down. Pylon collapses in one region should not result in a statewide blackout.
LikeLike
Followed by this after the AEMO preliminary report was released (the report has extremely fine time resolution leading up to the blackout):
AEMO preliminary report for the South Australian blackout last week. I don’t know how they could state that it was purely a “weather event”
http://www.aemo.com.au/Media-Centre/-/media/BE174B1732CB4B3ABB74BD507664B270.ashx
Note the speed at which the events took place on page 10 in table 3. There was no time for load/demand shedding to save South Australia’s grid after the Heywood interconnector tripped as it only took half a second from there for the generators to trip and only 7 seconds from the first batch of wind farms that tripped.
And there was even less synchronous inertia online than I had supposed – only 3 of the 4 Torrens B units were online so only 860 MW of synchronous generators, not 1060 (table 1, page 8).
LikeLike
My letter to The Minister For Energy and The Environment on the weekend following the South Australian blackout. This was written prior to the release of the AEMO preliminary report.
———————————————————————
Dear Sir
Thankyou for sending me a response to my comment from the 23rd of July this year. I hope you will re-evaluate its content in light of the recent blackout in South Australia. Unfortunately, in the interest of keeping my comment straightforward, I simplified the South Australian situation to what I believed would be the most likely cause for a statewide blackout. I had thought that the blackout would probably occur this summer when low production and high demand are likely so I focused on the possibility of a generation shortfall. As such, I neglected to outline the other effects of the high penetration of renewable energy sources that can compromise a grid’s stability. These other effects manifested themselves with the surges and short circuits that are inevitable during a period of wild weather.
The renewables lobby and their allies in The Greens party will focus on the loss of transmission from the northwest of Adelaide. They are rightfully pointing out that this is the region from where the now closed Northern and Playford coal powered stations were located so that even if these stations were still operating, their capacity would still have been lost during Wednesday’s storm.
What they either fail to realise or else wish to conceal is that the vast majority of South Australia’s remaining thermal generation capacity is now concentrated around Adelaide itself. This includes all of the base load generators – the Torrens A and B stations with their gas boiler powered generators and the Pelican Point combined cycle gas turbine powered generator.
Past practice for stormy conditions would have been for almost all of these base load generators to be online not only to supplement the output of the Northern and Playford stations but to be available in the unlikely but possible event that the northwest transmission link to the coal stations was lost. Examination of the AEMO generation data shows that only the Torrens B station was online at the time of the blackout with the consequences outlined below.
The combined generating capacity of the Torrens A & B and Pelican Point power stations is 1758 MW while Torrens B by itself at 800 MW makes up less than half of that total (the actual breakup up of generation capacity is Torrens A: 4 x 120 MW, Torrens B: 4 x 200 MW, Pelican Point: 478 MW). In addition, the Ladbroke and Hallett peaking plants were online, adding another 260 MW of generation capacity. Why the amount of generator capacity online is important requires some basic power engineering knowledge.
As with all traditional power stations, the generators can be regarded as extremely large and heavy three phase versions of car alternators driven by large and heavy turbines. All these spin at a speed locked to the grid frequency and at the same voltage phase (the peaks and dips all occur at the same time). The generators output at a fixed voltage so any variation in power output is through change in current – if demand increases, more current must be output by the generators and if demand decreases, then current must also decrease. This is in accordance with Ohms Law which states Power = Volts x Amps. With some types of load (eg induction motors), some of the current flow is not directly related to the power being generated due to the overall current being delivered slightly later than the voltage. To simplify things, this component (termed reactive power and current) will be ignored as it does not directly affect the grid behaviour which led to the blackout.
The generators are turned by the turbines and the power delivered by the turbine is the torque by the rotation rate – this is the same relationship as for car engines where Power = Torque x RPM. Essentially, because generators are run at a fixed RPM, the torque needed to turn the generator is directly related to the current flowing through the generator – the current produces a braking torque in the generator that matches off against the driving torque of the turbine.
In a perfect world, the power plant operators would know exactly what the demand (current requirement) is and would adjust the power driving the generator to keep the RPM constant by burning more or less fuel to drive the turbine harder or more gently. In the real world, the demand will change and if it increases, since the power turning the generator has not then the current flow increase will cause the generator to slow down, reducing frequency, since torque required must increase – RPM = Power / Torque. The plant operator and systems will then react to the slowing down by increasing the power of the turbine to bring the speed back up. If demand falls, then the generator will speed up, increasing frequency, and the turbine power must be decreased.
Since all the power plant generators connected to a grid run at a speed locked to the grid frequency, they will all slow down or speed up together causing the grid frequency to change. Normally, a baseload plant will have its generators run at a specified power level while peaking plants alter their power output to keep the grid frequency as close as possible to that specified (50 Hz in Australia). If a peaking plant is driven too hard, however, it pull out of phase from the grid in which case protection circuits isolate that generator from the grid and it no longer supplies power.
Now being large, heavy assemblies, the turbine and generator units have a significant amount of rotational inertia – they will want to keep spinning at the current speed if either the demand or turbine power changes – which provides frequency (synchronous) inertia. This is the basis for a stable grid in the face of power surges or short circuits. With multiple large generators online, the effect is that of a very large generator with the synchronous inertia being the total of the online units.
If there is a short circuit from a branch falling across power lines or a pylon collapse, the larger the amount of synchronous inertia, the smaller the frequency drop that will occur. Or if there is a surge from a lightning strike, then the larger the amount of synchronous inertia, the smaller the frequency rise. The danger of having a low amount of synchronous inertia is that in the event of a short circuit or a surge, the grid frequency can change by an amount large enough, before the fault is isolated, for some generators to fall out of synchronization with the grid. As with the peaking plant example, protection circuits will isolate the unsynchronised generator which further reduces the grid’s synchronous inertia. This can quickly lead to a cascading condition which results in a grid collapsing. In the worst cases, the generators will fall offline before the cause of the fault is isolated, making recovery more difficult.
The wind turbines that have been installed in Australia are almost all of types that supply power through electronics and provide absolutely no synchronous inertia at all (additional circuitry is available for some models to provide a small amount of synthetic inertia ). This meant that during Wednesday’s event, there was only the 1060 MW of generation capacity providing synchronous inertia to stabilise the South Australian grid.
We know that the Heywood interconnector disconnected from the South Australian grid due to an “under frequency event”. This was probably due to a massive short circuit from the pylon failure near Port Augusta causing the Torrens B units (and peaking plants) to slow. From there, the isolation of the South Australian grid meant that demand was far greater than the amount being generated causing the cascading generator disconnections. The wind farms would have also disconnected due to overloading.
The fact that pylons collapsed on Wednesday is unfortunate. Such events ensured that there would have been blacked out portions within the South Australian grid. What should not have happened is the total state blackout. The lack of baseload generators running in the Adelaide region is a direct consequence of the pricing subsidies via PPA’s and REC’s that made them uneconomic to be running. With more than half of the baseload generators offline, there was not enough synchronous generation to stabilise the grid long enough for the protection mechanisms to isolate the faults, controlled demand shedding (selective blackouts) nor generator ramping to cover the loss of the Heywood interconnector.
The irony of the statements by the AEMO and Electranet that the blackout was a weather event and not caused by renewables is that their joint report from February on South Australia warns against this type of situation and the consequences.
Click to access Joint%20AEMO%20ElectraNet%20Report_19%20February%202016.pdf
The renewables lobby and The Greens are already dreaming up excuses as to why renewables were not connected with the blackout and how further renewable and battery deployment would have prevented it. This is all spin as the amounts of electricity storage (the only thing that could possibly have helped) required is not realistic, either technically nor economically. Please pursue the investigation to provide the underlying causes made the blackout possible and not just the trigger event that caused the blackout itself.
Yours Respectfully
Greg Kaan
LikeLike
Following the release of the AEMO preliminary report, I sent another letter to the Minister based on the event sequence in table 3 on page 10 plus some of the other sections.
https://www.aemo.com.au/Media-Centre/-/media/BE174B1732CB4B3ABB74BD507664B270.ashx
My interpretation of events also takes into consideration the generation levels from the South Australian wind farms and thermal generators preceding the blackout
http://energy.anero.id.au/wind-energy/2016/september/28
http://energy.anero.id.au/fossil-energy/2016/september/28
I also looked at the interconnector flows preceding the blackout from the AEMO archives but the time resolution is far better in the preliminary report.
The rule change request that I mention is detailed in the ABC article below
http://www.abc.net.au/news/2016-10-04/electricity-security-complex-in-sa-says-koutsantonis/7899302
——————————————————————————————–
Dear Sir
First of all, please accept my apology for the error in my diagnosis of the South Australian blackout cause in my previous comment on Sunday. I had based my diagnosis from the statement by the Premier of South Australia, Jay Weatherill, that he had been advised by the head of the AEMO that the blackout was wholly a weather event with no contribution from renewable generation.
The preliminary report on the blackout which was released by the AEMO today now shows that wind farms were directly involved in the sequence of events that led to the blackout. This is of even more concern as it demonstrates that the wind farms are not only incapable of providing stability support for a grid but are unstable themselves in the face of grid disrupting events such as short circuits and power surges. The extremely short time interval between the wind farms falling offline and the loss of the Hazelwood Interconnector shows why the South Australian grid operators, ElectraNet, had no chance to shed demand as the events unfolded. This is why synchronous inertia is so important – the grid operators need that margin of stability in order to put emergency procedures into effect so that a blackout can be limited rather than statewide.
The rule changes requested in July by the South Australian Minister for Mineral Resources and Energy, Tom Koutsantonis, to limit flow on the Heywood lnterconnector based on the amount of online inertia available in South Australia, indicates that the situation was fully appreciated by the South Australian government. The statements by the South Australian government since the blackout indicate a disturbing level of denial .
Again, I implore you to pursue the investigation to provide the underlying causes made the blackout possible and not just the trigger event that caused the blackout itself.
Yours Respectfully
Greg Kaan
LikeLike