
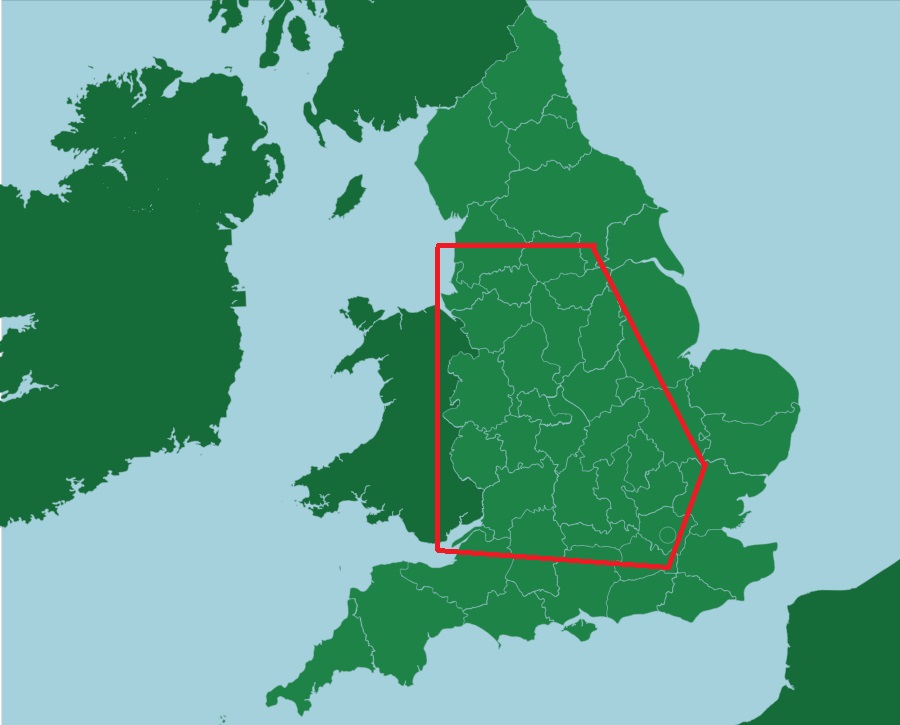
Figure above: The Central England Temperature area (with apologies to the Welsh)
This post covers accuracy issues related to the Central England Temperature (CET) series, created initially by Gordon Manley in 1953, and maintained in recent decades by the UK Met Office Hadley Centre. The HadCET data itself is plotted on the HadCET page, which also contains download links.
Definition
CET is meant to be a series of absolute average temperatures, presumably at some location roughly in the “middle” of the area containing the source station data.
It might have been better to have made CET an average of temperature variations, which would have made it easier to change the station composition.
My Version of Central England Temperatures
A reconstruction of monthly average mean temperature variations back to 1760, from around 30 long temperature records, is given at diymetanalysis:
Example 05: CENTRAL ENGLAND Tavg
The analysis cited above reveals a small inhomogeneity in monthly CET Tavg, shown in the following two figures:
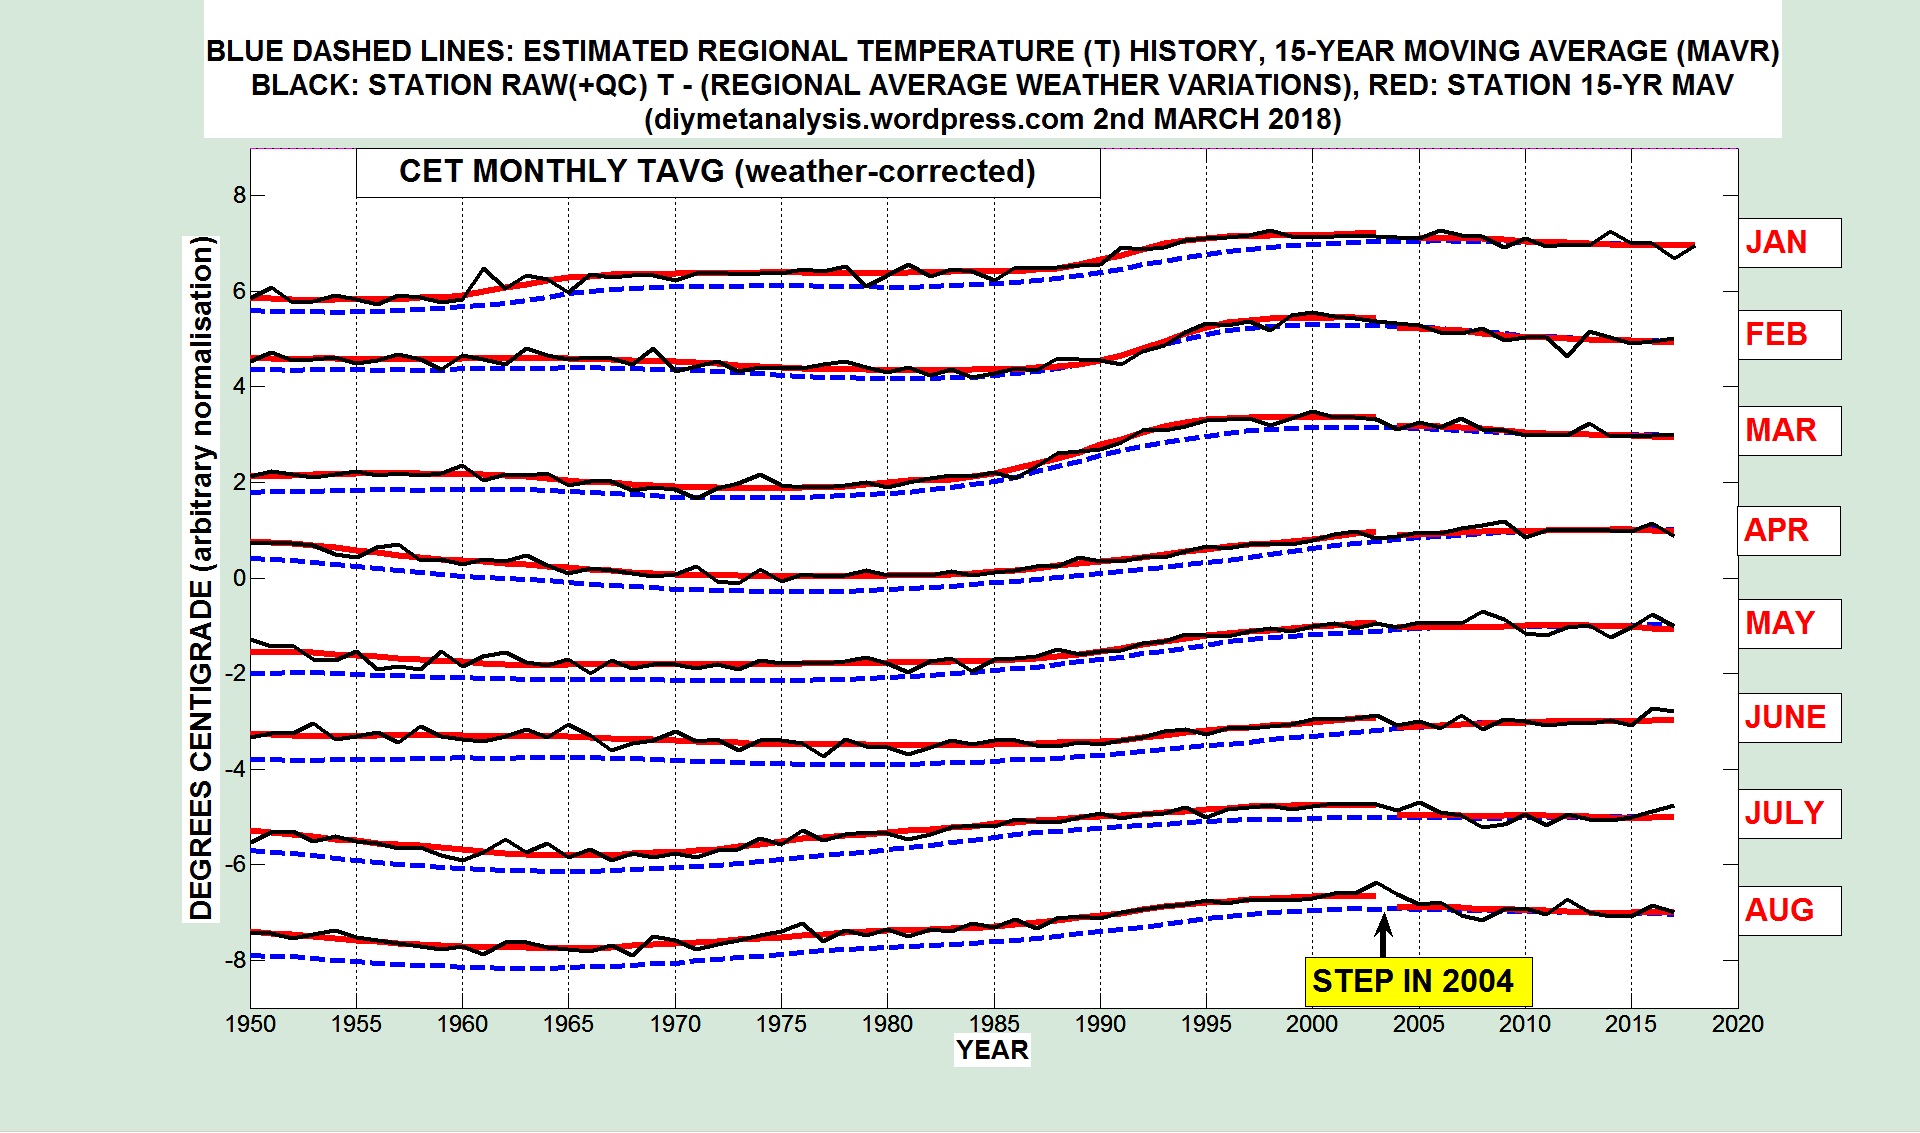
The small anomalous step down in temperatures is in 2004, which corresponds to a date on which there was a change in the station composition, see the following reference for details of that and other changes:
Click to access ParkerHorton_CET_IJOC_2005.pdf
Philip Eden version
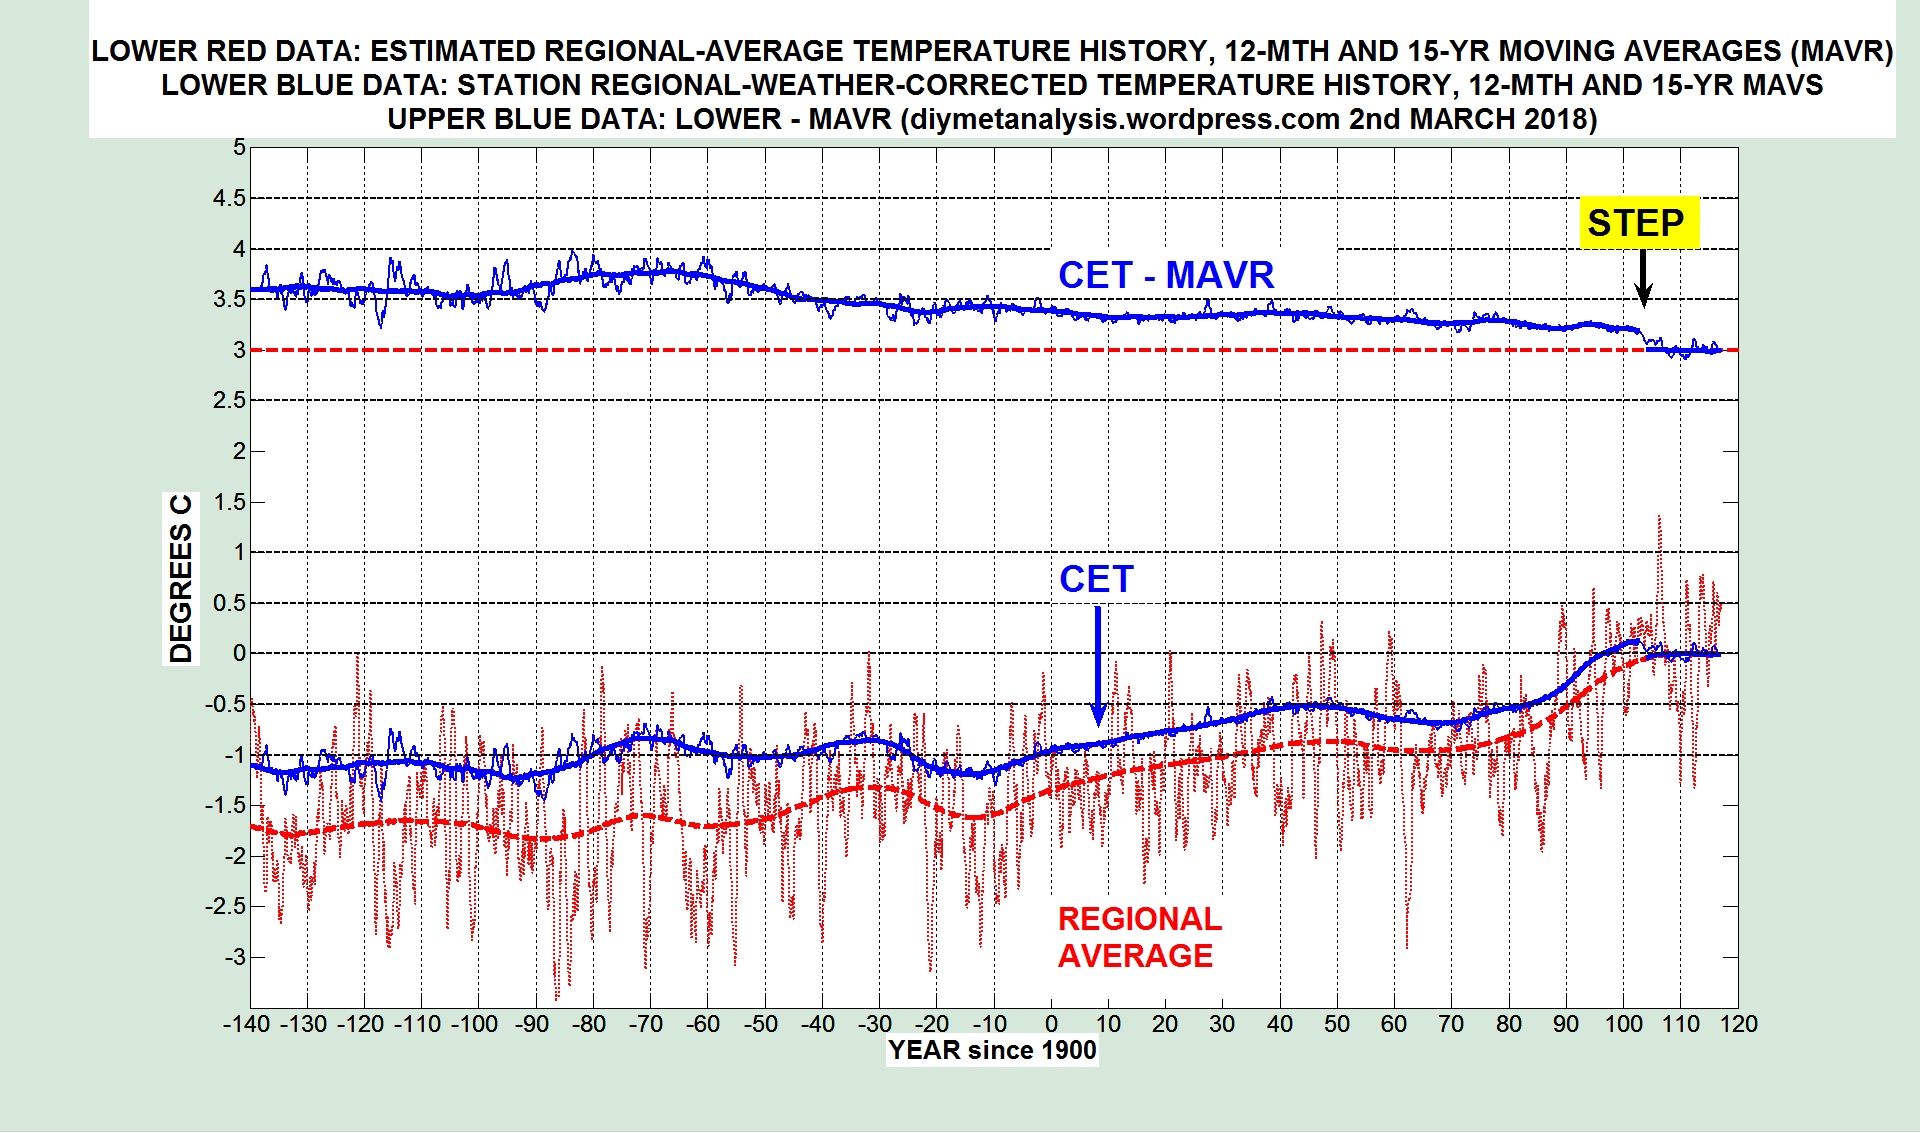
An alternative version was being created by Philip Eden (a distinguished British meteorologist, now deceased), and the following figure shows both HadCET (the official version) and the Eden version, and their difference, all as 12-month moving averages:

Note that the Philip Eden version (in blue) is a bit warmer than HadCET from around 2005, removing some of the 2004 inhomogeneity shown above.
Sources
- Eden version: http://www.climate-uk.com/page5.html
- HadCET: see the page above
VERSION ISSUES
The following figure shows that there are small but potentially significant differences between different sources of HadCET data, in this case monthly Tmax data derived from GHCND, versus the Met Office website version. It should NOT be concluded from this single example that there are no other differences between versions.

END OF POST

Please get yourself a decent filter, not a distorting running mean (and find out why you need one).
Data corruption by running mean “smoothers”:
best regards.
LikeLike
So far this post only shows 12-month moving averages, similar to annual averages, but providing much more information.
Later on there will be 15-year “moving averages”, and these already appear in earlier posts, but they are not simple running means, see the ALGORITHMS page for exactly what they are. They are designed to provide the “typical” temperature in the 15-year period, with resistance to extremes, which is why they are not simple running means.
LikeLike