

Photo above: Cathedral Rocks Wind Farm, South Australia
1. INTRODUCTION
This page gives a summary of wind power in South East Australia (SA, VIC and TAS), and provides an index of posts on that subject.
Peak demand for electricity in South Australia and Victoria occurs in late afternoon/early evening of summer heatwaves, so there is great interest in the amount of wind power generated in such weather conditions. Wind power and demand data are available only for a limited number of years, but in its absence weather data can be used to assess the wind speeds (and hence estimate the wind power today) of past heatwaves.
Posts on Wind Power during storms
Posts on Capacity Factors during heatwaves
- https://climanrecon.wordpress.com/2016/04/23/early-warning-system-for-south-australia/
- https://climanrecon.wordpress.com/2016/04/28/heatwaves-andwind-power-in-south-australia/
- https://climanrecon.wordpress.com/2016/05/04/heatwaves-and-electricity-capacity-in-south-australia/
- https://climanrecon.wordpress.com/2016/05/07/wind-power-capacity-credit-in-south-australia/
- https://climanrecon.wordpress.com/2016/11/29/the-winds-of-oz/
- https://climanrecon.wordpress.com/2016/12/30/christmas-2016-in-south-australia/
2. 21st CENTURY HEATWAVES in SA
Synoptic charts are available from the BoM for Australia back to the summer of 1999/2000, so I show below the summer daily maximum temperatures at Adelaide Kent Town (BoM station id 23090) back to that summer:


3. WIND POWER IN RECENT HEATWAVES
Recent heatwaves (since 2011) are important for analysis purposes because there is wind power and demand data available. The many wind farms in SE Australia are separated here into 6 regional groups, marked 1 to 6 on the following map:
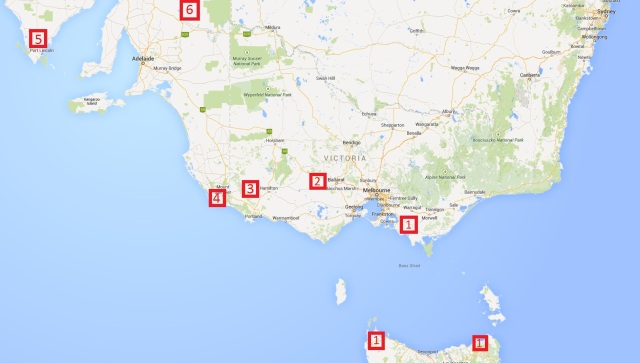
- Group 1: Bald Hills, Toora, Wonthaggi, Musselroe, Woolnorth
- Group 2: Mount Mercer, Hepburn, Waubra, Ararat, Coonooer, Challicum
- Group 3: Macarthur, Portland, Codrington, Yambuk, Oaklands, Mortons Lane
- Group 4: Lake Bonny, Canunda, Starfish Hill
- Group 5: Cathedral Rocks, Mount Millar
- Group 6: Clements Gap, Waterloo, Hallett, Hornsdale, Snowtown, Wattle Point, Bluff Range, North Brown Hill
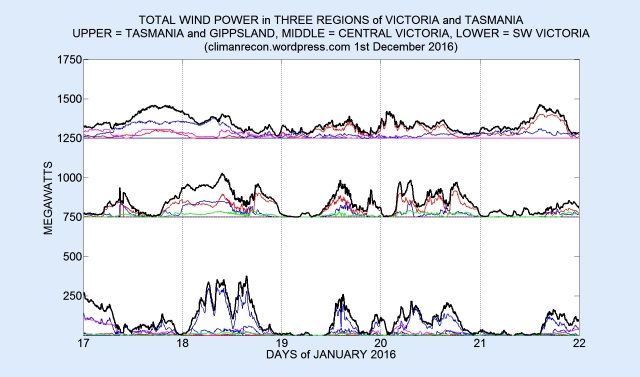
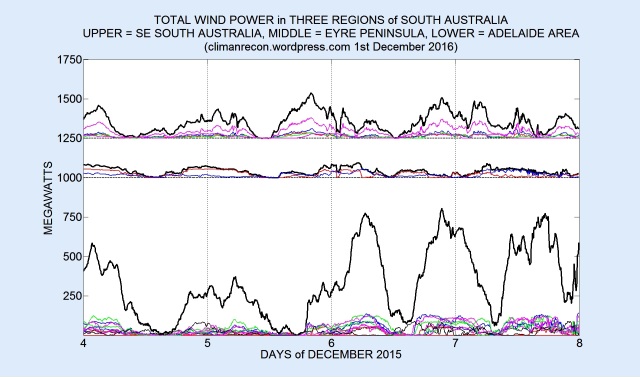
The following sub-sections show the total wind power for each group of wind farms, at 5-minute resolution, for all days for which the maximum temperature at Adelaide Kent Town exceeded 35C. Group 1 is at the top, group 6 at the bottom.
3.1 2016 March 5-8 (38.7, 38.0, 30.7, 37.1C):


3.2 2016 February 21-23 (37.0, 39.5, 37.0C)


3.3 2016 January 17-21 (36.6, 38.5, 35.9, 34.3, 36.7C):

3.4 2016 January 9-13 (34.8, 37.6, 37.9, 39.8, 35.1C):

 3.5 2015 December 30 – 2016 January 1 2016 (38.1, 40.6, 35.0C)


3.6 2015 December 14-19 (37.2, 36.2, 41.1, 42.9, 40.8, 43.2C)


3.7 2015 December 4-7 (34.8, 40.2, 41.5, 38.5C)

3.8 2015 November 17-19 (35.7, 40.1, 37.4C):


4. EARLIER HEATWAVES
4.1 January 13-17th 2014 (42.1, 45.1, 43.7, 44.2, 42.7C)


The following figure, produced by the AEMO, indicates that there was very low wind power at the times of peak demand on 13th and 15th January 2014:

Note that SA wind power was consistently higher at night than during the day.
4.2 29th-31st January 2011 (37.7, 42.5, 42.9C)


The low wind speeds suggested by the synoptic charts above are confirmed by the wind power data reported by the AEMO in the following figure:

Note again that SA wind power was higher at night than during the day.
More to follow …
