
The previous post gave a high level summary of the current status of the Tasmanian electricity system, as it deals with the continued absence of Basslink, and with the approach of winter, the peak demand period. The Derwent hydro basin was identified as an area where there might be unnecessary over-consumption of water, as gas and diesel generators lie idle. This post looks at the Derwent hydro basin in more detail.
The Derwent hydro basin is divided into an Upper region, with substantial water reservoirs feeding four power stations in that region, and a Lower region with six power stations along the River Derwent. The water reservoirs form three groups, Lakes St. Clair and King William in the West, a number of small lagoons and ponds in the centre, and Lake Echo in the East. The following figure shows the water storage history for the past six years:

The figure above shows that two of the groups of water storage have relatively normal levels for this time of year, the exception being Lake Echo, which has only around half the amount of water it should have.
With the aim of understanding the Lake Echo water level I have extracted the daily average number of MW generated by Lake Echo Power Station, and the downstream Tungatinah Power station, since May 2015. The data are converted to capacity factors, and plotted in the following graph:

The Lake Echo Power Station discharges its water into Dee Lagoon, which has the following history of water level back to July 2015:

Source: http://www.hydro.com.au/system/files/water-storage/Web_Lakes_DEE.pdf
There is a very clear correlation between the Lake Echo Power Station MW output and the level of Dee Lagoon, suggesting that the power station only draws water from Lake Echo when it is generating electricity, at least since July 2015. The recent jump in the level of the Dee Lagoon matches in time a recent spell of heavy rainfall in the area.
Dee Lagoon feeds water into Tungatinah Lagoon (the local water storage for Tungatinah Power Station), which also gets water from other sources, and which has the following history of water level back to July 2015:
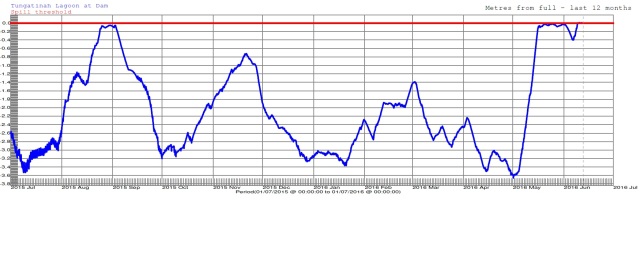
Source: http://www.hydro.com.au/system/files/water-storage/Web_Lakes_TUNGATINAH.pdf
The MW output of Tungatinah Power Station appears to be driven by the level of Tungatinah Lagoon, especially when water is nearly or actually spilling.
Conclusions
There does not appear to be a single major event or cause of the very low level of Lake Echo, but rather it is probably due to the cumulative effect of a bit too much consumption relative to inflow over the past few years. In particular one has to ask why electricity was generated from Lake Echo for export via Basslink during July 2015, from a reservoir that was in need of replenishment?
The output from Tungatinah Power Station, which gets some of its water from small reservoirs, has the expected seasonal variation, high in the “wet” season and low in the “dry” season.
