
This is a tale of 3 key numbers, that combine to paint a scary picture for consumers of electricity in the state of South Australia. In short, from 2018, the state will not have enough electricity available to it to reliably meet its periods of maximum demand.
Two of the key numbers are illustrated in the following figure, showing recent data for maximum electricity demand in the state (blue), together with the maximum available dispactable supply within the state (red):
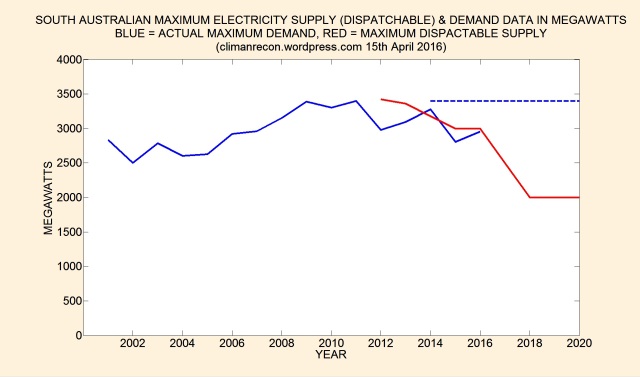
Maximum Demand: 3400 MW
Maximum demand in South Australia occurs during summer heatwaves, and it reached its highest figure in 2011, at a value of around 3400 MW. Recent years have shown lower figures, but this may be due mainly to weather patterns, rather than to changes in consumer behavior. 2015 had 3 summer heatwaves, the first one in early January produced the highest demand, but it occurred during the Christmas/summer holiday period, so was lower than it could have been. There were two additional (2-day) heatwaves in February 2015, but they both occurred exactly at weekends, resulting in much lower demands than they could have done. 2016 had a relatively cool summer. There is no reason why maximum demands of 3400 MW or more will not recur in the near future.
Note that past negotiated demand reductions and rooftop solar contributions are already accounted for in the actual demand data.
Maximum Dispactable Supply: 2000 MW (from 2018)
The figure of 2000 MW is taken from a spreadsheet produced by the AEMO in March 2016; it is what they refer to as “Summer Aggregate Scheduled Generation”, but without the contribution from wind. The drop from the current figure of around 3000 MW is due to the closure of Northern Power Station (coal) in 2016, and Torrens A (gas) in 2017.
It is important to stress that this figure represents the MAXIMUM possible power that can be produced, the actual figure of available power is likely to be somewhat less. I’m no economist, but it seems likely that the dispactable supply is dropping towards the figure that the generators expect to be able to sell routinely; this figure is likely to drop even further in the future as more wind and solar are deployed.
Interconnector Capacity: 870 MW (when the Heywood upgrade is complete)
This is the maximum power that is expected to be available from the Heywood (650 MW) and Murraylink (220 MW) connectors, and is dependent on both of them achieving their design capacities, and on Victoria having that amount of surplus power available during periods of maximum demand.
The availability of 870 MW of surplus power from Victoria must be in doubt at certain times as it too has a maximum demand figure (10,490 MW) that exceeds its maximum dispactable supply figure (10,400 MW).
Discussion
During periods of maximum and nearly-maximum demand, which typically last for several hours for each of several consecutive days, the deficit of dispactable power will be (at least):
3400 (demand) – max local supply (2000) – max interconnector supply (870) = 630 MW
Renewable sources of electricity in South Australia can sometimes provide 630 MW, but sometimes they cannot, and sometimes they produce essentially nothing, and this will be the case regardless of growth in their nominal capacity. The AEMO produced this plot in 2012 to illustrate the almost total absence of wind during a 2011 heatwave:
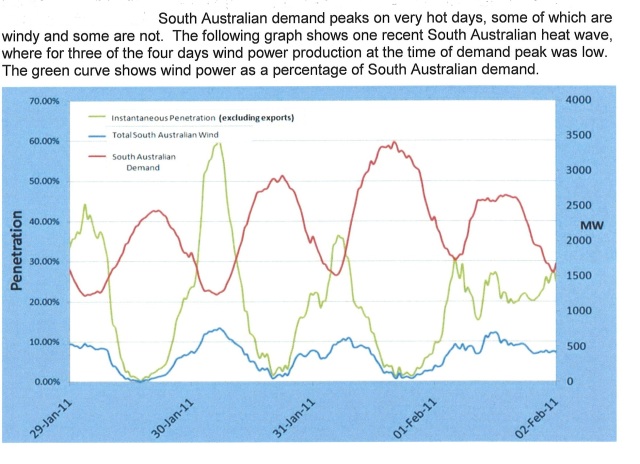
Thus, from 2018, South Australia must prepare for power cuts during summer heatwaves.
Sources
Demand data from CSV file available here: https://www.aer.gov.au/industry-information/industry-statistics/wholesale-statistics/seasonal-peak-demand-region
Supply data from spreadsheets available here: http://www.aemo.com.au/Electricity/Planning/Related-Information/Generation-Information

Your ‘dispatchable’ figure includes the OCGTs. As these are short term producers, and prone to damage/breakdowns if run more than 15% of the time, it is unlikely that all of that capacity will be available when needed.
A second point is that above 38℃ wind turbines aren’t allowed to operate because of the danger of overheating the lubricating oil and subsequent fires (brought in after just such event).
A third point is that the interconnectors too get hot at full load, and capacity has to be reduced during very hot weather.
LikeLike
Do you have a reference for the wind turbine shutdown temperature ruling, Graeme?
I have seen complaints about wind turbines based on this issue because the turbines were allowed to operate during Victorian total fire ban periods
LikeLike
Sorry, no reference.
Apart from my bad habit of not saving references I had a computer crash just before Christmas, so have had to go through the backups. I found a note Oct. 2014 but no reference.
I think that it may have been on ramblingsdc.net (a wind enthusiast site but far away from the lunatic fringe) but cannot find that limit mentioned. Some pages seem to have been up-dated.
I did find that there is a limit “Wind generators have a high temperature alarm at around 43 degrees and will shutdown at around 45 degrees to protect components. That’s measured at the nacelle 70m above ground” (Pacific Hydro – operator).
“The Adelaide Advertiser on 12th February 2006 that the operators of the Lake Bonney Stage 2 wind farm said that all its 46 turbines shut down on January 22nd when temperatures exceeded 40C”.
Elsewhere I found a comment that unless special batteries are installed the computer control system can be affected above 40C, so it seems that there is a limit, but not 38C.
I must apologise for this. I don’t make things up, and I know that I did see it, so will keep trying to find a definite reference.
LikeLike
No problem, Graeme – I recently made a monumental error in a statement on Energy Matters so I am in no position to pass any sort of judgement.
Incidentally, did you see my post,there, regarding Dr Diesendorf’s upcoming presentation on “his newest report showing that South Australia could produce 100% of its electricity from renewable sources”?
I would love to go to ask the questions on his assumptions that the green, renewables lobby seem unable to grasp. It will be at 111 Franklin St Adelaide at 6pm, 16 June.
http://www.adelaide.foe.org.au/mark-diesendorf-100-renewable-for-sa/
LikeLike
Scratch that – I just saw your reply on Energy Matters
LikeLike
When peak demand is due to heat waves, should not PV production coincide nearly perfectly with peak demand? Or are there heat waves without sunshine?
LikeLike
Rooftop solar PV reduces heatwave peaks and tends to shift the peaks to later in the day, but current and past rooftop solar contributions are effectively already present in the actual demand data, which would have been higher without it. With the peaks shifted to later times more rooftop solar has a constantly diminishing effect on the peak demand.
LikeLike
Oh, then it seems you still have next to nothing PV installed. Otherwise there should be a significant reduction in peak demand over the last years. As you can get now the PV installed for less money than coal plants, this might be the best option to reduce peak demand (assuming that it is mainly due to heat waves).
How long can the typical building in Southern Australia endure without cooling? A few hours? Then you could cool down the building during the PV peak slightly more than you are used to, then switch cooling off during the evening and resume colling at night when a lot of other consumers are switched off.
LikeLike
Yes. At night when northerlies blow very hot air from the inland down to Adelaide
LikeLike
Greg,
when there is noticeable wind, you would expect wind power to contribute significantly, or?
LikeLike
Gunter, it is just as likely that the northerlies die out at night having already heated the city. The wind only has to die down for a few minutes for the shortfall in dispatchable generation and interconnector capacity to cause the grid to fail.
Back at the beginning of November 2015, a very large partial blackout occurred when demand wasn’t particularly large due to the larger of the interconnectors going offline.
http://www.abc.net.au/news/2015-11-02/electricity-interconnector-fails-power-blackouts-south-australia/6904062
The finger was pointed at the substation at one end of the interconnector but it illustrates the vulnerability of South Australia’s electricity supply even before all the closures, mentioned in this post.
In the summer of 2016/2017, the South Australian grid will have just enough thermal and interconnector capacity (if every plant is operational) to cover peak demand making a mass blackout very likely – a repeat of the November incident or a failure of one of the larger CCGT plants can no longer be coped with by “demand management”. With the shortfall after the closure of Torrens A, the mass blackout will be inevitable.
LikeLike
Here’s a web page that shows, in real time, how much electricity is being generated around Australia from each type of source.
Note that the aim of the website is to show how wonderful renewable energy is, but the data often goes against them (e.g. Thursday 18 Feb at 09:20 when there’s absolutely no wind power in the entire National Electricity Market ).
LikeLike
test
LikeLike
sorry – just checking I could still post. It looks like my comments with links are blocked
LikeLike
Not sure why that happened, there was a limit of 2 links per comment, I’ve increased that now to a limit of 5, please try again.
LikeLike
Well to shift demand to noon where solar power delivers is just a question of price incentives.
Bigger airconditioning systems already are based on cold water, and they can store the energy conserved in the cold water easily for some hours every day, if there is a incentive. We’ve already had systems with pressureless 100m³ tanks included, which do not really cost much. But store about 200kWh thermal energy/60kWh electical energy. So a 60-80kWh cooling facility can skip a peak time of 3 hours without significant energy consumption during this peak time, and can make use of the higher efficiency during colder parts of the day when generating the cold water.
Why nobody in australia thinks about building a real grid remains a miracle.
LikeLike
A real grid? We have a real grid. Your proposition (whatever it is) is the theoretical one.
How do we store this cold water at households? Underground tanks at each home? The ones for apartment blocks would be rather large and difficult to install. Then we need to also install intelligent airconditioners to cool these during the midday period when the sun is shining and the wind is blowing (hopefully).
And then we need to add in the “passive” cooling system that draws the heat from the dwelling to the cool storage tank. Again, possible in a home but what about apartment blocks?
What you propose could be used to flatten demand but as you say, it is “just a question of price incentives”. More subsidies and fees – the neverending story for renewables.
If you like, I could do a costing for a home system based on current pricing for water tanks, excavation, air conditioning and evaporative cooling (as the passive cooling component). It won’t be cheap so the “incentive” will need to be large.
LikeLike
Auss, your statement about Australia not having a “real grid” is just plain wrong and is unnecessarily offensive. Even a quick glance at the NEM’s coverage of 5 states plus one territory, a distance of about 4000km, at voltages up to 500KV (AC and DC) will educate you.
Here’s an overview: http://www.aemo.com.au/electricity/planning/interactive-map/
I doubt that there is a larger grid anywhere in the world under s ingle management.
How big is your grid? An apology are in order.
It is widely recognised that the capacity of the interconnectors between SA and VIC/NSW is marginal. This is primarily due to three factors:
1. SA has for several years chased unreliable renewables, with the current goal of 50%.
2. Coal resources in SA are poor (lignite) and distant from the population centres and power stations. Competition from Victoria’s very cheap larger scale lignite-powered generators has eventually resulted in closure of the last coal fired SA power station a week ago.
3. Interstate rivalry and a bit of commercial game playing have occasionally been claimed to be at the root of delays to planned interconnector proposals. Hence, the network is not currently ideally configured. Proposed solar thermal and large scale PV projects have been dropped on commercial grounds.
Back in the real world, this has resulted in the problems that Greg Kaan described. Next Christmas will be interesting if Adelaide’s summer is hot, but that does not mean that the Australian NEM grid is not “real”. It will continue to be a remarkable national asset.
Where esle can hydro from the southern end of the grid travel 4000 km north to customers in Cairnes or the power stations of the Hunter Valley (coal) and the Snowy Mountains Hydro supply customers 1000km to the west more reliably than is the case in the NEM?
LikeLike
I don’t understand why “price incentives” have to mean “fees or subsidies”. I interpret the Auss post as positing the economic question: Why can’t pricing be used to signal to users the value of reducing/shifting their demand to match supply?
The wholesale price signal in the NEM is as big a price incentive as you will find anywhere in the world. 30 minute pricing from -$1,000/MWh to $13,800/MWh. The network element of electricity bills is now required by a national rule to be reflective of the LRMC of providing the network service (which in practice is likely to be reflected through charging mostly for a customer’s maximum demand at peak times). So there is no real regulatory barrier to some very strong price incentives that entail no “subsidy”.
It does require having a digital interval meter in place though. And these are currently widespread only for larger customers and in Victoria.
Of course, demand is not infinitely flexible. But it doesn’t necessarily need to be, especially not for the next decade or so. And there are many ways to achieve flexibility – electrical or heat storage (using water or other medium) are two examples. Not all customers need to be able to provide every form of storage/demand management.
In practice it’s not just about regulatory or technological capability, of course, given the politically charged nature of energy supply.
LikeLike
So how do the customers get informed of the wholesale spot pricing so they can switch load in or out of the grid?
If we were to upgrade to digital interval meters that could (somehow) receive spot pricing then people could program in their maximum pricing, possibly different maxima at different times through the day, so their demand can be shed as the spot price shifts. This could be used to tie in additional loads at low pricing points too if the meter has 2 or more control outputs with different maxima that could be used to switch loads in or out. The unknown for the system operators would be the amount of load shedding (or increase) that would occur as the price changed so there could be wild oscillations as prices were adjusted to try and balance demand with generation. Meanwhile, with wind and solar, the generation would be changing as well (since they have caused this requirement in the first place) so pricing would be continually shifting.
Of course none of this is deployed as yet so the control issue is not something that has to be dealt with.
LikeLike
yes, in practice it is unlikely to be or need to be based around exposure to spot pricing. At present it remains easiest and relatively cheap for retailers to hedge out their spot exposure than to find ways of inducing demand response. This is also partly due to the lack of time/demand-based network tariffs. There would likely be an iterative process whereby competing retailers try out different ways to interest customers in providing demand response. I suspect that this will likely involve very little “real-time” engagement by customers. Short term DR will likely be based on paying customers for the right to access automatic demand response (DRED)-enabled devices. Aircon can be cycled off for 20 mins/hour without loss of amenity. So at anytime you could have 1 in 3 airconditioners off in a region/network area (Energex in QLD have the largest program of this type, albeit for network support rather than wholesale energy market purposes. New appliance standards mean that DRED-enabled aircon and pool pumps will become the norm.
Consistent price signals to avoid consumption at peak periods will create a financial rationale for customers to invest in storage – batteries or heating/cooling appliances that are based on stored water or other medium (so-called phase-change materials). these can either be pre-set on a time basis if the value of DR is predictable enough, according to a price algorithm as you suggest, or potentially subject to direct control within boundaries that don;t undermine the amenity of the appliance (i.e. you have hot water when you want a shower, your EV is sufficiently charged for a journey, etc.)
The problem is more political/social than technological/economic – there is a chicken and egg issue such that government will be reluctant to sanction widespread customer exposure to such prices unless there are enough demand mgt tools obviously available to them, but without widespread exposure there is unlikely to be a big enough market for many of the potential tools. Especially since politicians pay only lip service to the australian energy market agreement, which was designed to encourage a national approach to such matters.
LikeLike